
1 Proportion Z-Test Calculator: Z-Score and P-Value Explained
Use a 1 proportion z test calculator to find a z-score and p-value. Learn the inputs, assumptions, test directions, TI-84 steps, and how to interpret results.
Table of Contents
- Quick Answer: What Does the Calculator Test?
- Enter the Right Values Before You Calculate
- Check Whether the Normal Approximation Is Reasonable
- Binary Outcomes and Suitable Sampling
- Independent Observations
- Enough Expected Successes and Failures
- Choose the Alternative Hypothesis From the Question
- Understand the One-Proportion Z-Test Formula
- Worked Examples With Verified Results
- Example 1: Test a Claimed 50% Preference Rate
- Example 2: Investigate a Lower Complaint Rate
- Read the P-Value Without Overstating the Evidence
- Run 1-PropZTest on a TI-84
- Explain Different Outputs and Recognize the Wrong Test
- Frequently Asked Questions
- Can I use a 1 proportion z test calculator with only a percentage?
- What sample size do I need for a one-proportion z-test?
- Does a negative z-score mean the result is not significant?
- Is a two-tailed p-value always twice the one-tailed value?
- Can I report a confidence interval with the test?
- Why did my calculator display a p-value of zero?
- Report the Result in Context
A 1 proportion z test calculator compares a sample’s observed percentage with a claimed population percentage. Enter the number of successes, sample size, hypothesized proportion, and test direction. The calculator then finds a z-score and p-value, helping you judge whether the sample provides evidence against the claim.
Suppose a delivery service sets a 90% on-time benchmark. An audit will rarely produce exactly 90%, even when the underlying rate matches that benchmark. The test assesses how unusual the observed difference would be under the stated model.
Getting a result takes only a few inputs, but interpreting it requires care. A small p-value does not tell you the probability that the claim is false. You also need suitable data, an appropriate sample size, and a test direction chosen before examining the results.
Quick Answer: What Does the Calculator Test?
A one-proportion z-test evaluates a claim about one population proportion using binary sample data. It calculates:
$$z = \frac{\hat{p} - p_0}{\sqrt{\frac{p_0(1 - p_0)}{n}}}$$
Where:
- $\hat{p}$ is the sample proportion ($\frac{x}{n}$)
- $p_0$ is the claimed null proportion
- $n$ is the sample size
The selected alternative hypothesis determines the p-value. Use this method for questions about one rate against a fixed benchmark. Comparing two independently measured rates requires a two-proportion test instead.
Enter the Right Values Before You Calculate
Most calculators use summary counts. Some accept a sample proportion instead, so read the input labels before entering your data.
| Input | Meaning | Example |
|---|---|---|
| Successes, $x$ | Observations meeting the defined condition | 174 |
| Sample size, $n$ | Total observations analyzed | 300 |
| Null proportion, $p_0$ | Claimed population rate | 0.50 |
| Alternative hypothesis | Difference you want to test | $p \neq 0.50$ |
| Significance level, $\alpha$ | Preset threshold for the test decision | 0.05 |
“Success” is simply the outcome being counted. It can mean a late delivery, a defective product, or a “yes” response. Define it before collecting or classifying observations.

For count-based inputs, $x$ must be an integer from zero through $n$, and $n$ must be a positive integer. The usual z-test requires $0 < p_0 < 1$ because a boundary value makes its standard error zero.
Enter 50% as 0.50 unless the field explicitly requests a percentage. Do not enter 0.58 into a box labeled “successes” when the actual count is 174. If a report gives only a rounded percentage, try to recover the original count. Multiplying a rounded rate by $n$ may not reproduce the observations used in the study.
Check Whether the Normal Approximation Is Reasonable
The calculator can perform arithmetic even when the statistical method does not fit the data. Check the following conditions first:
Binary Outcomes and Suitable Sampling
Each observation must fall into one of two defined categories, such as complete/incomplete. Use a consistent definition across the sample. A random sample or another justified sampling design supports inference to the population. A voluntary poll can be biased even with thousands of responses. Increasing the sample size does not automatically fix selection bias.
Independent Observations
The ordinary model assumes independent trials with a common success probability. Repeated responses from the same person or strongly clustered observations can violate that assumption.
For simple random sampling without replacement, a common practical check is that the sample contains no more than 10% of the population:
$$n \leq 0.10 \times N$$
This helps justify ignoring the finite-population correction; it does not eliminate every possible dependence problem.
Enough Expected Successes and Failures
A widely used introductory guideline is the Rule of 10:
$$n p_0 \geq 10 \quad \text{and} \quad n(1 - p_0) \geq 10$$
These are expected counts under the null hypothesis, not the observed success and failure counts. Some references use less conservative thresholds, but the rule of 10 is a useful default for introductory work.
For $n = 300$ and $p_0 = 0.50$, both expected counts equal 150. For $n = 40$ and $p_0 = 0.05$, only two successes are expected. The second situation is poorly suited to this normal approximation; consider an exact binomial test if the binomial assumptions hold.
Choose the Alternative Hypothesis From the Question
The null hypothesis states the reference claim:
$$H_0: p = p_0$$
Here, $p$ is the unknown population proportion. The alternative hypothesis describes the departure you are investigating:
| Research Question | Alternative Hypothesis | Calculator Selection |
|---|---|---|
| Is the rate higher than the benchmark? | $H_a: p > p_0$ | Right-tailed |
| Is the rate lower than the benchmark? | $H_a: p < p_0$ | Left-tailed |
| Does the rate differ in either direction? | $H_a: p \neq p_0$ | Two-tailed |
An investigation of a reduced complaint rate might use a left-tailed test. Checking whether a stated acceptance rate is inaccurate in either direction calls for a two-tailed test.
Choose the direction before looking at the sample result. Switching to a one-sided test after seeing which direction favors your claim changes the analysis and can inflate false-positive risk.
The same z-score produces different p-values for different alternatives. For a positive z-score, the right-tail probability is small and the left-tail probability is large. A two-sided test includes equally extreme departures on both sides of zero.
Understand the One-Proportion Z-Test Formula
First calculate the sample proportion:
$$\hat{p} = \frac{x}{n}$$
The symbol $\hat{p}$, pronounced “p-hat,” is your observed rate. It estimates the population proportion but is not automatically equal to it.
Next calculate the null standard error:
$$SE_0 = \sqrt{\frac{p_0(1 - p_0)}{n}}$$
This measures the expected sampling variation in the sample proportion when the null hypothesis is true.
Finally, standardize the observed difference:
$$z = \frac{\hat{p} - p_0}{SE_0}$$
The test statistic expresses the distance from the benchmark in standard-error units. Positive values indicate an observed rate above the benchmark; negative values indicate a rate below it.
Use $p_0$ in the denominator, not $\hat{p}$, for this standard one-sample proportion test. Replacing it with the sample proportion changes the procedure into a Wald test and can produce a different answer.
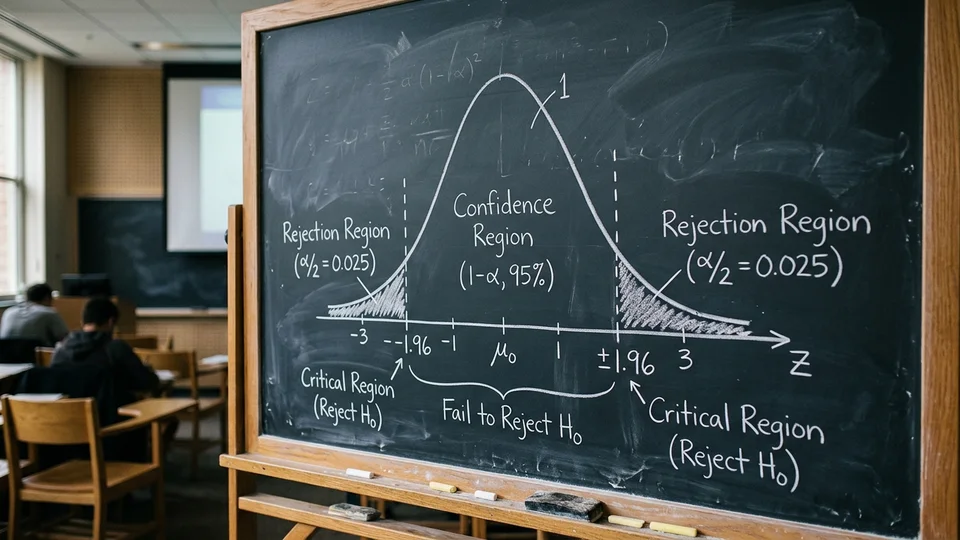
To obtain a p-value, the calculator uses the standard normal cumulative distribution function $\Phi(z)$:
- Left-tailed: $p\text{-value} = \Phi(z)$
- Right-tailed: $p\text{-value} = 1 - \Phi(z)$
- Two-tailed: $p\text{-value} = 2[1 - \Phi(|z|)]$
The two-sided expression uses the absolute z-score so that equally large positive and negative departures receive the same p-value.
Worked Examples With Verified Results
The following hypothetical examples use the normal approximation without continuity correction. Assume appropriate random sampling and independent observations.
Example 1: Test a Claimed 50% Preference Rate
A researcher asks 300 randomly selected users whether they prefer a new menu layout. Of those users, 174 select it. Test whether the population preference rate differs from 50%, using $\alpha = 0.05$.
The hypotheses are $H_0: p = 0.50$ and $H_a: p \neq 0.50$.
- Calculate the sample proportion: $$\hat{p} = \frac{174}{300} = 0.58$$
- Check expected counts: $300 \times 0.50 = 150$ successes and 150 failures. Both exceed 10.
- Calculate the standard error: $$SE_0 = \sqrt{\frac{0.50 \times 0.50}{300}} \approx 0.028868$$
- Calculate the test statistic: $$z = \frac{0.58 - 0.50}{0.028868} \approx 2.7713$$
- Determine the p-value: The two-tailed p-value is approximately 0.0056. Because it is below 0.05, reject $H_0$ at the 5% significance level.
A suitable conclusion is: “The sample provides strong evidence that the population preference rate differs from 50%.” The observed rate is 58%, eight percentage points above the benchmark.
Example 2: Investigate a Lower Complaint Rate
A support team uses 10% as a fixed complaint-rate benchmark. In a random audit of 500 cases, 34 contain complaints. The question specified in advance is whether the rate is below 10%.
Here, $\hat{p} = 34 / 500 = 0.068$, and $H_a: p < 0.10$.
- Expected counts: Under $H_0$, expected counts are 50 complaints and 450 noncomplaints. Both exceed 10.
- Standard error: $$SE_0 = \sqrt{\frac{0.10 \times 0.90}{500}} \approx 0.013416$$
- Test statistic: $$z = \frac{0.068 - 0.10}{0.013416} \approx -2.3851$$
- Left-tailed p-value: Approximately 0.0085.
At $\alpha = 0.05$, the sample supports a population complaint rate significantly below the benchmark. The observed difference is 3.2 percentage points.
Read the P-Value Without Overstating the Evidence
A p-value measures how likely a test statistic at least as extreme as the observed one would be, assuming the null hypothesis and model assumptions hold.
- It is not the probability that $H_0$ is true. A p-value of 0.0056 does not mean there is a 0.56% chance that the benchmark is correct.
- For a decision at a predetermined significance level:
- If $p\text{-value} \leq \alpha$, reject $H_0$.
- If $p\text{-value} > \alpha$, fail to reject $H_0$.
Failing to reject does not prove equality. The sample may simply provide too little evidence to detect a real difference.
Statistical significance also does not measure practical importance. Report the observed rate, benchmark, percentage-point difference, and sample size alongside the p-value. A tiny difference can matter little operationally even when a large study detects it reliably.
Run 1-PropZTest on a TI-84
On the TI-84 family, the relevant command is 1-PropZTest, available through the statistics tests menu.

To reproduce Example 1:
- Press STAT and move right to TESTS.
- Select 5: 1-PropZTest…
- Enter $p_0 = 0.5$.
- Enter $x = 174$ and $n = 300$.
- Select the $\neq p_0$ alternative.
- Choose Calculate.
The result displays:
- $z \approx 2.7713$
- $p \approx 0.0056$ (the p-value)
- $\hat{p} = 0.58$
- $n = 300$
If you get a domain error, check that $x$ is a whole-number count, $x \leq n$, $n$ is positive, and $p_0$ lies strictly between zero and one.
Explain Different Outputs and Recognize the Wrong Test
Two calculators can disagree slightly without either being broken. Check the selected tail, input precision, and calculation method:
- Continuity correction: Adjusts the normal approximation for discrete counts.
- Exact binomial test: Calculates probabilities directly from the binomial formula without normal approximation.
Also check whether the problem really involves one population rate:
| Data or Question | More Suitable Approach |
|---|---|
| One binary sample against a fixed rate | One-proportion test |
| Two independent samples with estimated rates | Two-proportion test |
| Paired binary measurements before and after | McNemar’s test |
| A numerical average (e.g., mean waiting time) | One-sample t-test for a mean |
Frequently Asked Questions
Can I use a 1 proportion z test calculator with only a percentage?
You also need the sample size. Some calculators accept $\hat{p}$ directly, while others require the success count $x$. If the percentage is exact, multiply its decimal form by $n$ to recover $x$. When the percentage is rounded, obtain the original count rather than inventing a fractional count.
What sample size do I need for a one-proportion z-test?
There is no universal minimum. Under the rule of 10, require $np_0 \geq 10$ and $n(1 - p_0) \geq 10$. A benchmark near zero or one needs a larger sample. Separately, detecting a small meaningful difference may require substantially more observations for adequate statistical power.
Does a negative z-score mean the result is not significant?
No. The sign shows direction, while significance depends on the tail probability and chosen threshold. A large negative z-score can provide strong evidence in a left-tailed or two-tailed test.
Is a two-tailed p-value always twice the one-tailed value?
For the uncorrected normal z-test, the two-tailed p-value is twice the smaller tail probability. It is not necessarily twice the probability for whichever direction you selected.
Can I report a confidence interval with the test?
Yes. A confidence interval describes the estimated population rate and its uncertainty, while the test evaluates a particular benchmark. A corresponding Wilson score interval uses a consistent test inversion.
Why did my calculator display a p-value of zero?
For a finite z-score, the mathematical normal-tail probability is positive, although it can be extremely small. A calculator may round it to zero. Report a suitable bound, such as $p < 0.0001$, rather than claiming that the event has zero probability.
Report the Result in Context
Before using the output, confirm the success definition, sample count, benchmark, and test direction. Then report the observed proportion, z-score, p-value, and conclusion in language that answers the original question. A calculator makes the arithmetic faster; sound sampling and careful interpretation determine whether the answer is useful.
BigTechies Editorial Team
The Ratio Solver editorial team specializes in clear, step-by-step mathematical guides, statistical analysis explanations, and practical calculation workflows for students, educators, and professionals.
Solve Any Ratio in Seconds With Our Free Calculator
Simplify whole numbers, fractions, and decimals, find missing values, or divide totals in proportional parts with verified instant accuracy.
Related Articles
Continue exploring practical calculation guides and tutorials
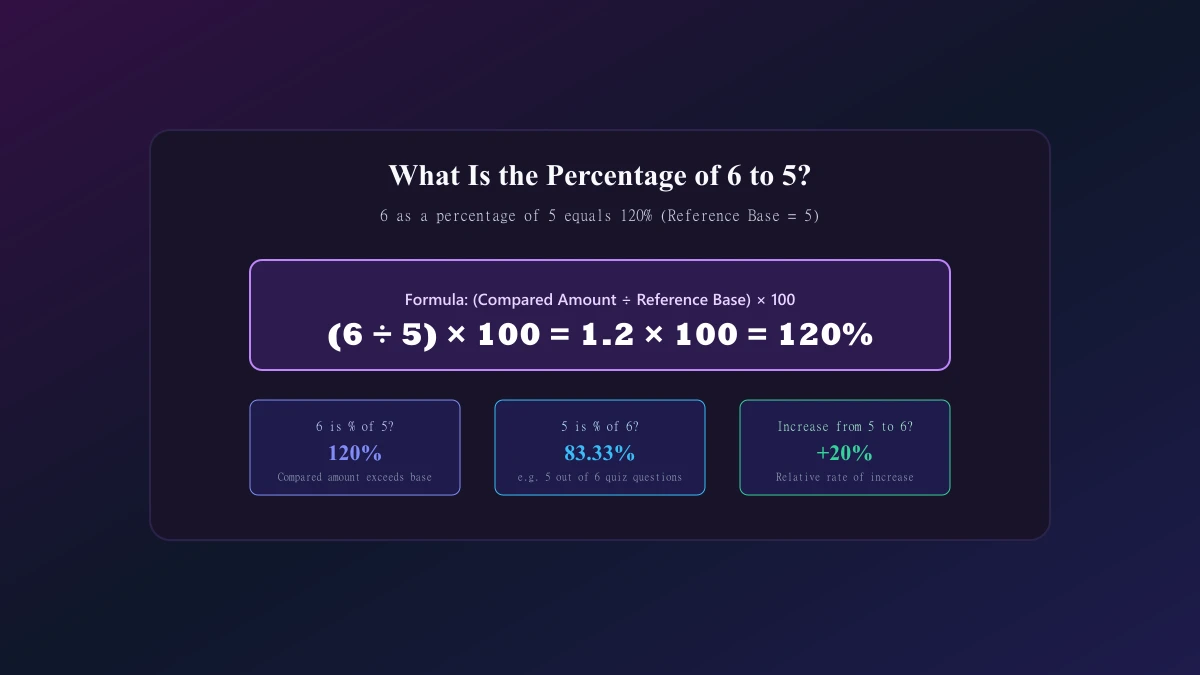
What Is the Percentage of 6 to 5? Answer With Easy Steps
Find out what is the percentage of 6 5 with clear steps and examples. Learn why the answer is 120%, how to reverse the calculation, and avoid common mistakes.
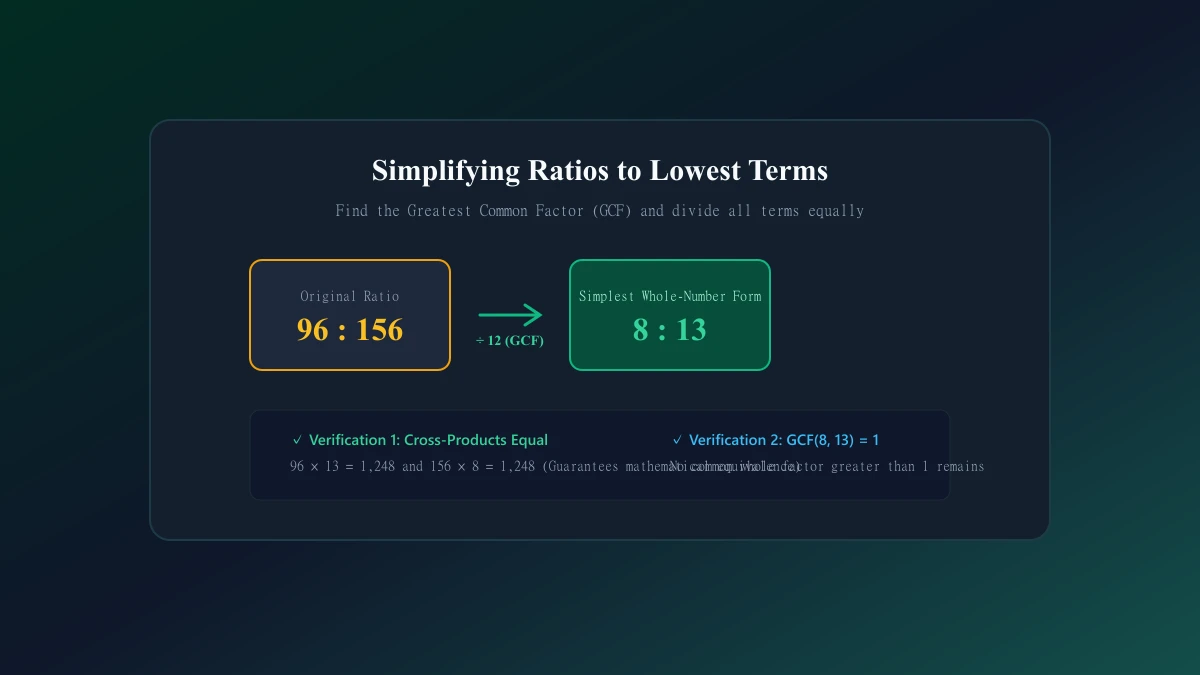
Ratio Simplifier: Reduce Ratios to Their Simplest Form
Use a ratio simplifier to reduce whole numbers, decimals, fractions, and three-part ratios. Learn GCF methods, check your answers, and avoid common mistakes.
What Is a Ratio? Definition, Types, and Everyday Examples
Learn what is a ratio, how to read and write one, and how ratios differ from fractions, rates, and proportions, with everyday examples and practice questions.